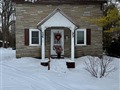
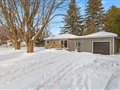
B12 Cedar St
$938,559
Comparative Market Analysis
Feb 5, 2025
NOT AN ACTIVE LISTING
Historical Performance
| Period | $ Change | % Change |
| 1 Day | +$321 | +0.034% |
| 7 Days | +$1,054 | +0.112% |
| 30 Days | +$2,258 | +0.241% |
| 3 Months | +$10.2k | +1.09% |
| 6 Months | +$44.7k | +5.00% |
| 1 Year | +$38.1k | +4.23% |
| 3 Years | +$357k | +61.4% |
| 5 Years | +$430k | +84.6% |
| 10 Years | +$635k | +209% |
List My Property
Real Estate Statistics
Financing Solutions
AS SEEN ON


Are You a Licensed Real Estate Agent or Broker?