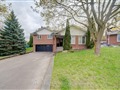
65 Queen St
$571,416
Comparative Market Analysis
Jul 4, 2025
NOT AN ACTIVE LISTING
Historical Performance
| Period | $ Change | % Change |
| 1 Day | +$207 | +0.036% |
| 7 Days | +$233 | +0.041% |
| 30 Days | -$819 | -0.143% |
| 3 Months | -$1,817 | -0.317% |
| 6 Months | +$8,387 | +1.49% |
| 1 Year | -$27.8k | -4.65% |
| 3 Years | +$90.2k | +18.8% |
| 5 Years | +$160k | +39.0% |
| 10 Years | +$328k | +134% |
List My Property
Real Estate Statistics
Financing Solutions
AS SEEN ON


Are You a Licensed Real Estate Agent or Broker?