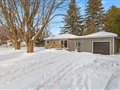
60 Talbot Dr
$441,157
Comparative Market Analysis
May 11, 2025
NOT AN ACTIVE LISTING
Historical Performance
| Period | $ Change | % Change |
| 1 Day | +$151 | +0.034% |
| 7 Days | +$488 | +0.111% |
| 30 Days | +$973 | +0.221% |
| 3 Months | +$4,033 | +0.923% |
| 6 Months | +$18.1k | +4.28% |
| 1 Year | +$6,171 | +1.42% |
| 3 Years | +$168k | +61.7% |
| 5 Years | +$286k | +184% |
| 10 Years | +$381k | +638% |
List My Property
Real Estate Statistics
Financing Solutions
AS SEEN ON


Are You a Licensed Real Estate Agent or Broker?