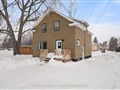
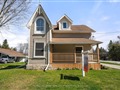
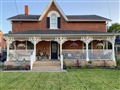
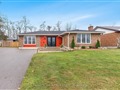
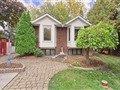
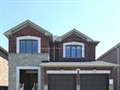
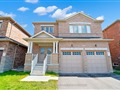
500 North St
$611,080
Comparative Market Analysis
May 9, 2025
NOT AN ACTIVE LISTING
Historical Performance
| Period | $ Change | % Change |
| 1 Day | +$218 | +0.036% |
| 7 Days | +$305 | +0.050% |
| 30 Days | -$554 | -0.091% |
| 3 Months | -$714 | -0.117% |
| 6 Months | +$11.9k | +1.99% |
| 1 Year | -$21.5k | -3.40% |
| 3 Years | +$124k | +25.4% |
| 5 Years | +$196k | +47.2% |
| 10 Years | +$395k | +183% |
List My Property
Real Estate Statistics
Financing Solutions
AS SEEN ON


Are You a Licensed Real Estate Agent or Broker?