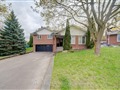
33 Queen St
$702,148
Comparative Market Analysis
Jul 4, 2025
NOT AN ACTIVE LISTING
Historical Performance
| Period | $ Change | % Change |
| 1 Day | +$254 | +0.036% |
| 7 Days | +$255 | +0.036% |
| 30 Days | -$1,156 | -0.164% |
| 3 Months | -$2,717 | -0.385% |
| 6 Months | +$9,317 | +1.34% |
| 1 Year | -$36.5k | -4.94% |
| 3 Years | +$104k | +17.4% |
| 5 Years | +$185k | +35.9% |
| 10 Years | +$384k | +121% |
List My Property
Real Estate Statistics
Financing Solutions
AS SEEN ON


Are You a Licensed Real Estate Agent or Broker?