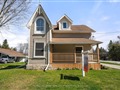
19 Nancy Ave
$575,858
Comparative Market Analysis
May 11, 2025
NOT AN ACTIVE LISTING
Historical Performance
| Period | $ Change | % Change |
| 1 Day | +$205 | +0.036% |
| 7 Days | +$291 | +0.051% |
| 30 Days | -$513 | -0.089% |
| 3 Months | -$740 | -0.128% |
| 6 Months | +$10.8k | +1.92% |
| 1 Year | -$22.4k | -3.74% |
| 3 Years | +$116k | +25.2% |
| 5 Years | +$192k | +50.0% |
| 10 Years | +$352k | +157% |
List My Property
Real Estate Statistics
Financing Solutions
AS SEEN ON


Are You a Licensed Real Estate Agent or Broker?