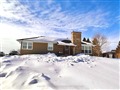
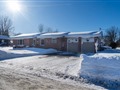
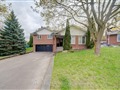
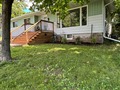
19 Mcnabb St
$369,789
Comparative Market Analysis
May 10, 2025
NOT AN ACTIVE LISTING
Historical Performance
| Period | $ Change | % Change |
| 1 Day | +$134 | +0.036% |
| 7 Days | +$135 | +0.036% |
| 30 Days | -$609 | -0.164% |
| 3 Months | -$1,431 | -0.385% |
| 6 Months | +$6,205 | +1.71% |
| 1 Year | -$13.1k | -3.41% |
| 3 Years | +$84.4k | +29.6% |
| 5 Years | +$152k | +69.4% |
| 10 Years | +$253k | +216% |
List My Property
Real Estate Statistics
Financing Solutions
AS SEEN ON


Are You a Licensed Real Estate Agent or Broker?