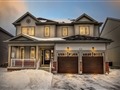
11 Rennie St
$793,431
Comparative Market Analysis
Jul 1, 2025
NOT AN ACTIVE LISTING
Historical Performance
| Period | $ Change | % Change |
| 1 Day | +$274 | +0.035% |
| 7 Days | +$245 | +0.031% |
| 30 Days | -$1,393 | -0.175% |
| 3 Months | -$3,130 | -0.393% |
| 6 Months | +$10.6k | +1.35% |
| 1 Year | -$41.3k | -4.95% |
| 3 Years | +$126k | +18.9% |
| 5 Years | +$212k | +36.6% |
| 10 Years | +$441k | +125% |
List My Property
Real Estate Statistics
Financing Solutions
Browsing History
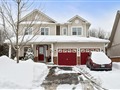
7 Rennie St, Brock
6 seconds ago
AS SEEN ON

Are You a Licensed Real Estate Agent or Broker?